In a previous post, I used Maximum Mean Discrepancy to detect regime changes in financial time series. MMD works well as a retrospective tool—look back at the data, compare windows, and ask whether something changed. But it can't tell you a shift is happening right now, and when it flags a change, you get a test statistic rather than a probability.
This project explores an alternative: Bayesian Online Change Point Detection (BOCPD), from Adams & MacKay (2007). It processes data one observation at a time and tells you not just that something changed, but how confident it is about when the change happened.
BOCPD is a general-purpose change point detection method—it works on any time series where you suspect the underlying behavior shifts over time, whether that's climate measurements, industrial sensor readings, or network traffic. I'm using stock price data here because it's a domain with well-documented regime changes (crashes, recoveries, bear markets) that make it easy to evaluate whether the detections make sense.
How It Works
Imagine you're watching the stock market every day. BOCPD is constantly asking one question: how long has the current regime been going?
It tracks a quantity called the run length—the number of days since the last shift. Rather than committing to a single answer, the algorithm keeps a probability for every possibility simultaneously. Maybe there's a 60% chance the current regime started 50 days ago, a 10% chance it started 5 days ago, and so on.
When the market genuinely shifts, the probabilities reorganize. Mass drains away from "this regime has been going for a while" and piles up on "something new just started." That collapse is a detected change point.
Three things drive each daily update:
-
How long do regimes usually last? This is your prior belief, controlled by a "hazard function." You might assume every day is equally likely to be a transition, or you might believe that older regimes are more fragile.
-
Does today's data fit the current regime? The algorithm compares each new observation against what it's learned about the current regime so far. A big surprise—a day that looks nothing like recent history—pushes probability toward "new regime."
-
What did we believe yesterday? Yesterday's beliefs carry forward and get updated. This is the Bayesian machinery at work: each day refines the picture rather than starting from scratch.
The algorithm also produces a predictive envelope—a forecast for tomorrow that widens after a change point (reflecting fresh uncertainty) and tightens as the new regime becomes familiar.
For the full mathematical development, see the introductory slides from the course presentation.
Reproducing the Original Paper
Before applying BOCPD to modern markets, I validated the implementation by reproducing Figure 3 from the original Adams & MacKay (2007) paper—Dow Jones Industrial Average daily returns from 1972 to 1975.
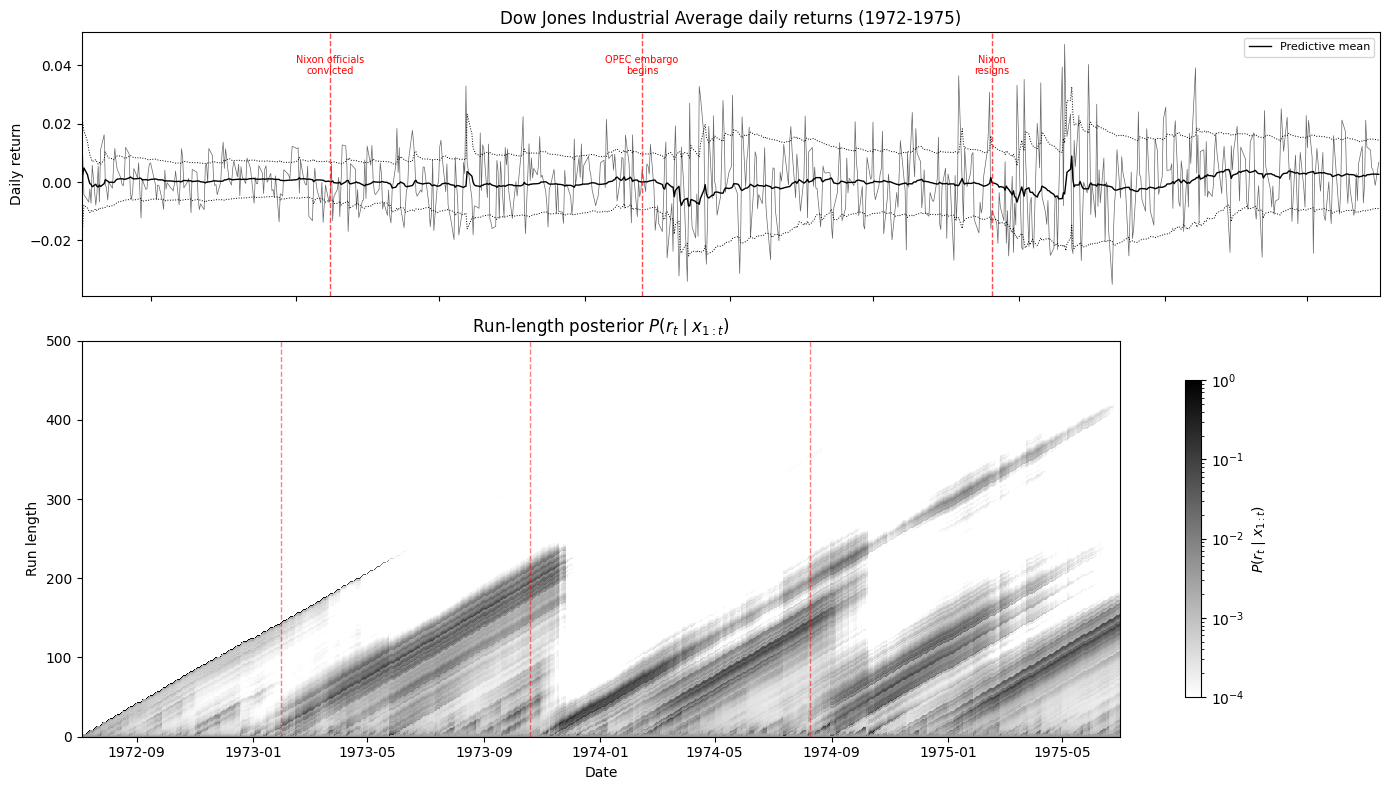
This is a period rich with known disruptions: the conviction of Nixon's aides in January 1973, the OPEC oil embargo beginning in October 1973, and Nixon's resignation in August 1974. The algorithm picks up each of these—you can see the "staircase" pattern in the bottom panel, where the run length grows steadily during stable periods and drops to zero at each disruption.
Matching the original paper's results confirmed the implementation was correct before moving on to more ambitious experiments.
Results on S&P 500 Data
I applied BOCPD to SPY (S&P 500 ETF) data in two configurations: one using only daily returns, and one using five daily features (open, high, low, close, and volume).
The single-feature model on SPY daily returns from 2018–2024 detected 8 change points:
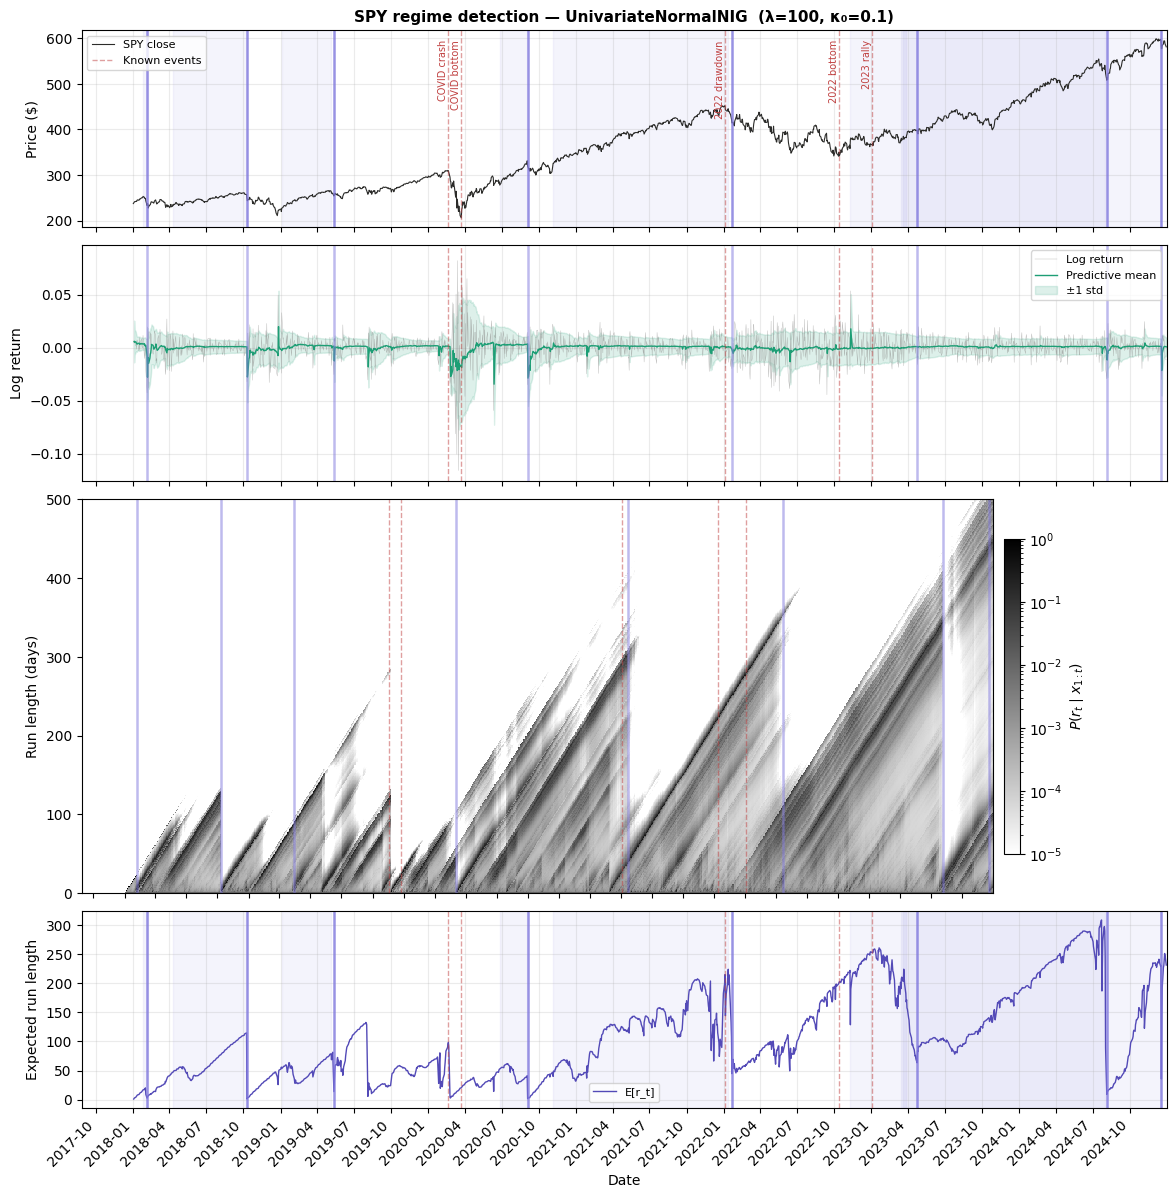
The top panel shows detected boundaries aligning with major market events—the COVID crash, the recovery, the 2022 drawdown, the August 2024 volatility spike. The second panel is the predictive envelope: notice how it blows out during volatile regimes and tightens during calm ones. The heatmap (third panel) shows the full belief state—bright diagonal bands are stable regimes growing older, and the vertical stripes are change points where beliefs collapse. The bottom panel summarizes everything as a single trace, with sharp drops at each detection.
Each detection comes with a credible interval—a range of dates where the shift likely occurred. The COVID crash onset has a tight 14-day interval, while the 2022 drawdown has a much wider one, reflecting genuine ambiguity about when that slow deterioration really began.
The five-feature model on SPY from 2020–2026 detected 11 change points:
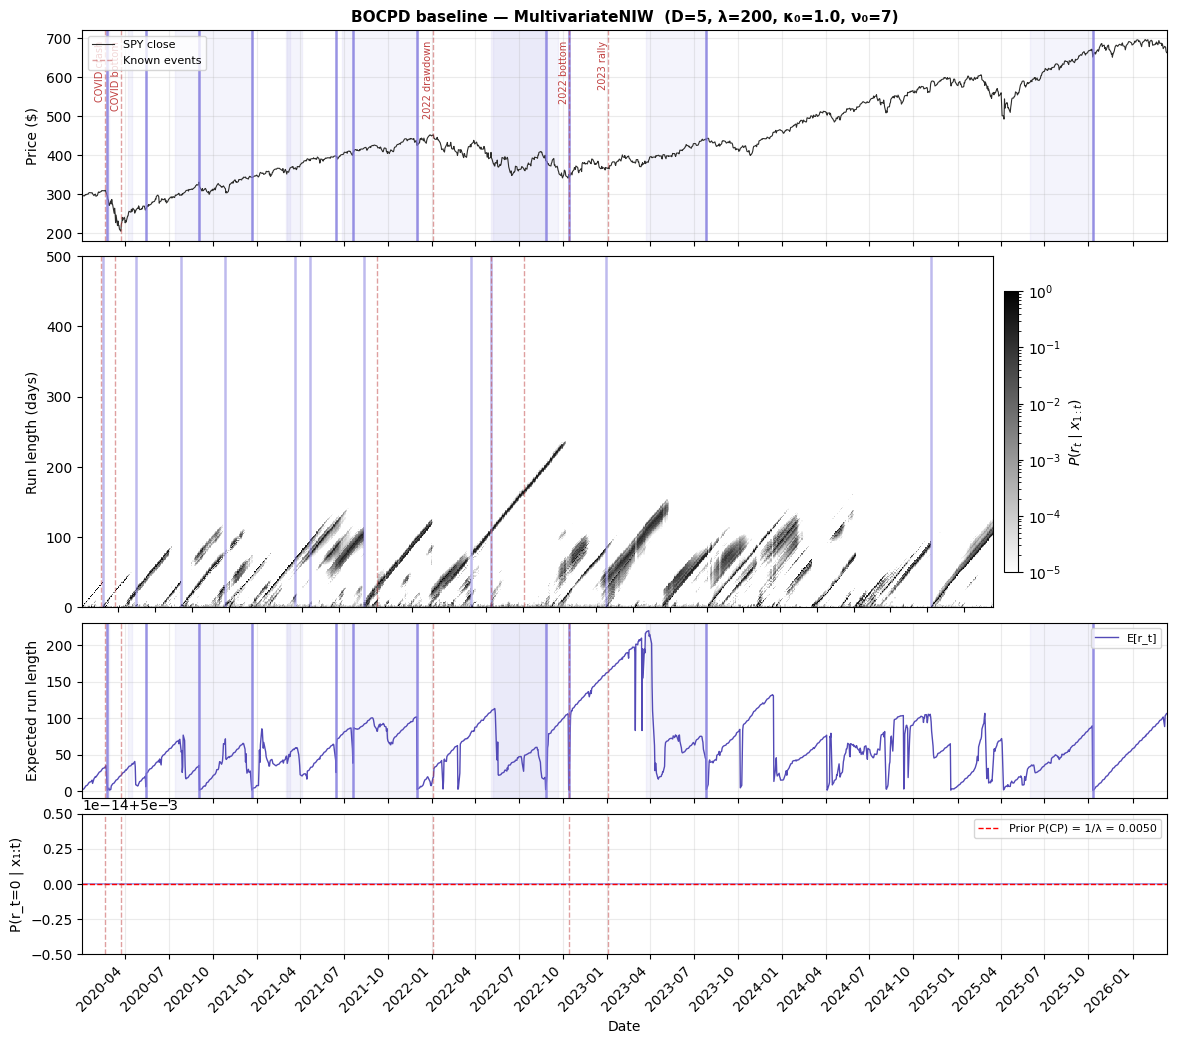
More features give the model more to work with. The five-feature detections include transitions the single-feature model misses, particularly around the COVID recovery and mid-2021 shifts where price structure changed in ways that daily returns alone didn't capture.
Does It Actually Work? Testing on Synthetic Data
Real markets don't come with a ground truth—we can never be sure when a regime "really" changed. So I generated synthetic data with known change points planted at specific locations and asked: does BOCPD find them?
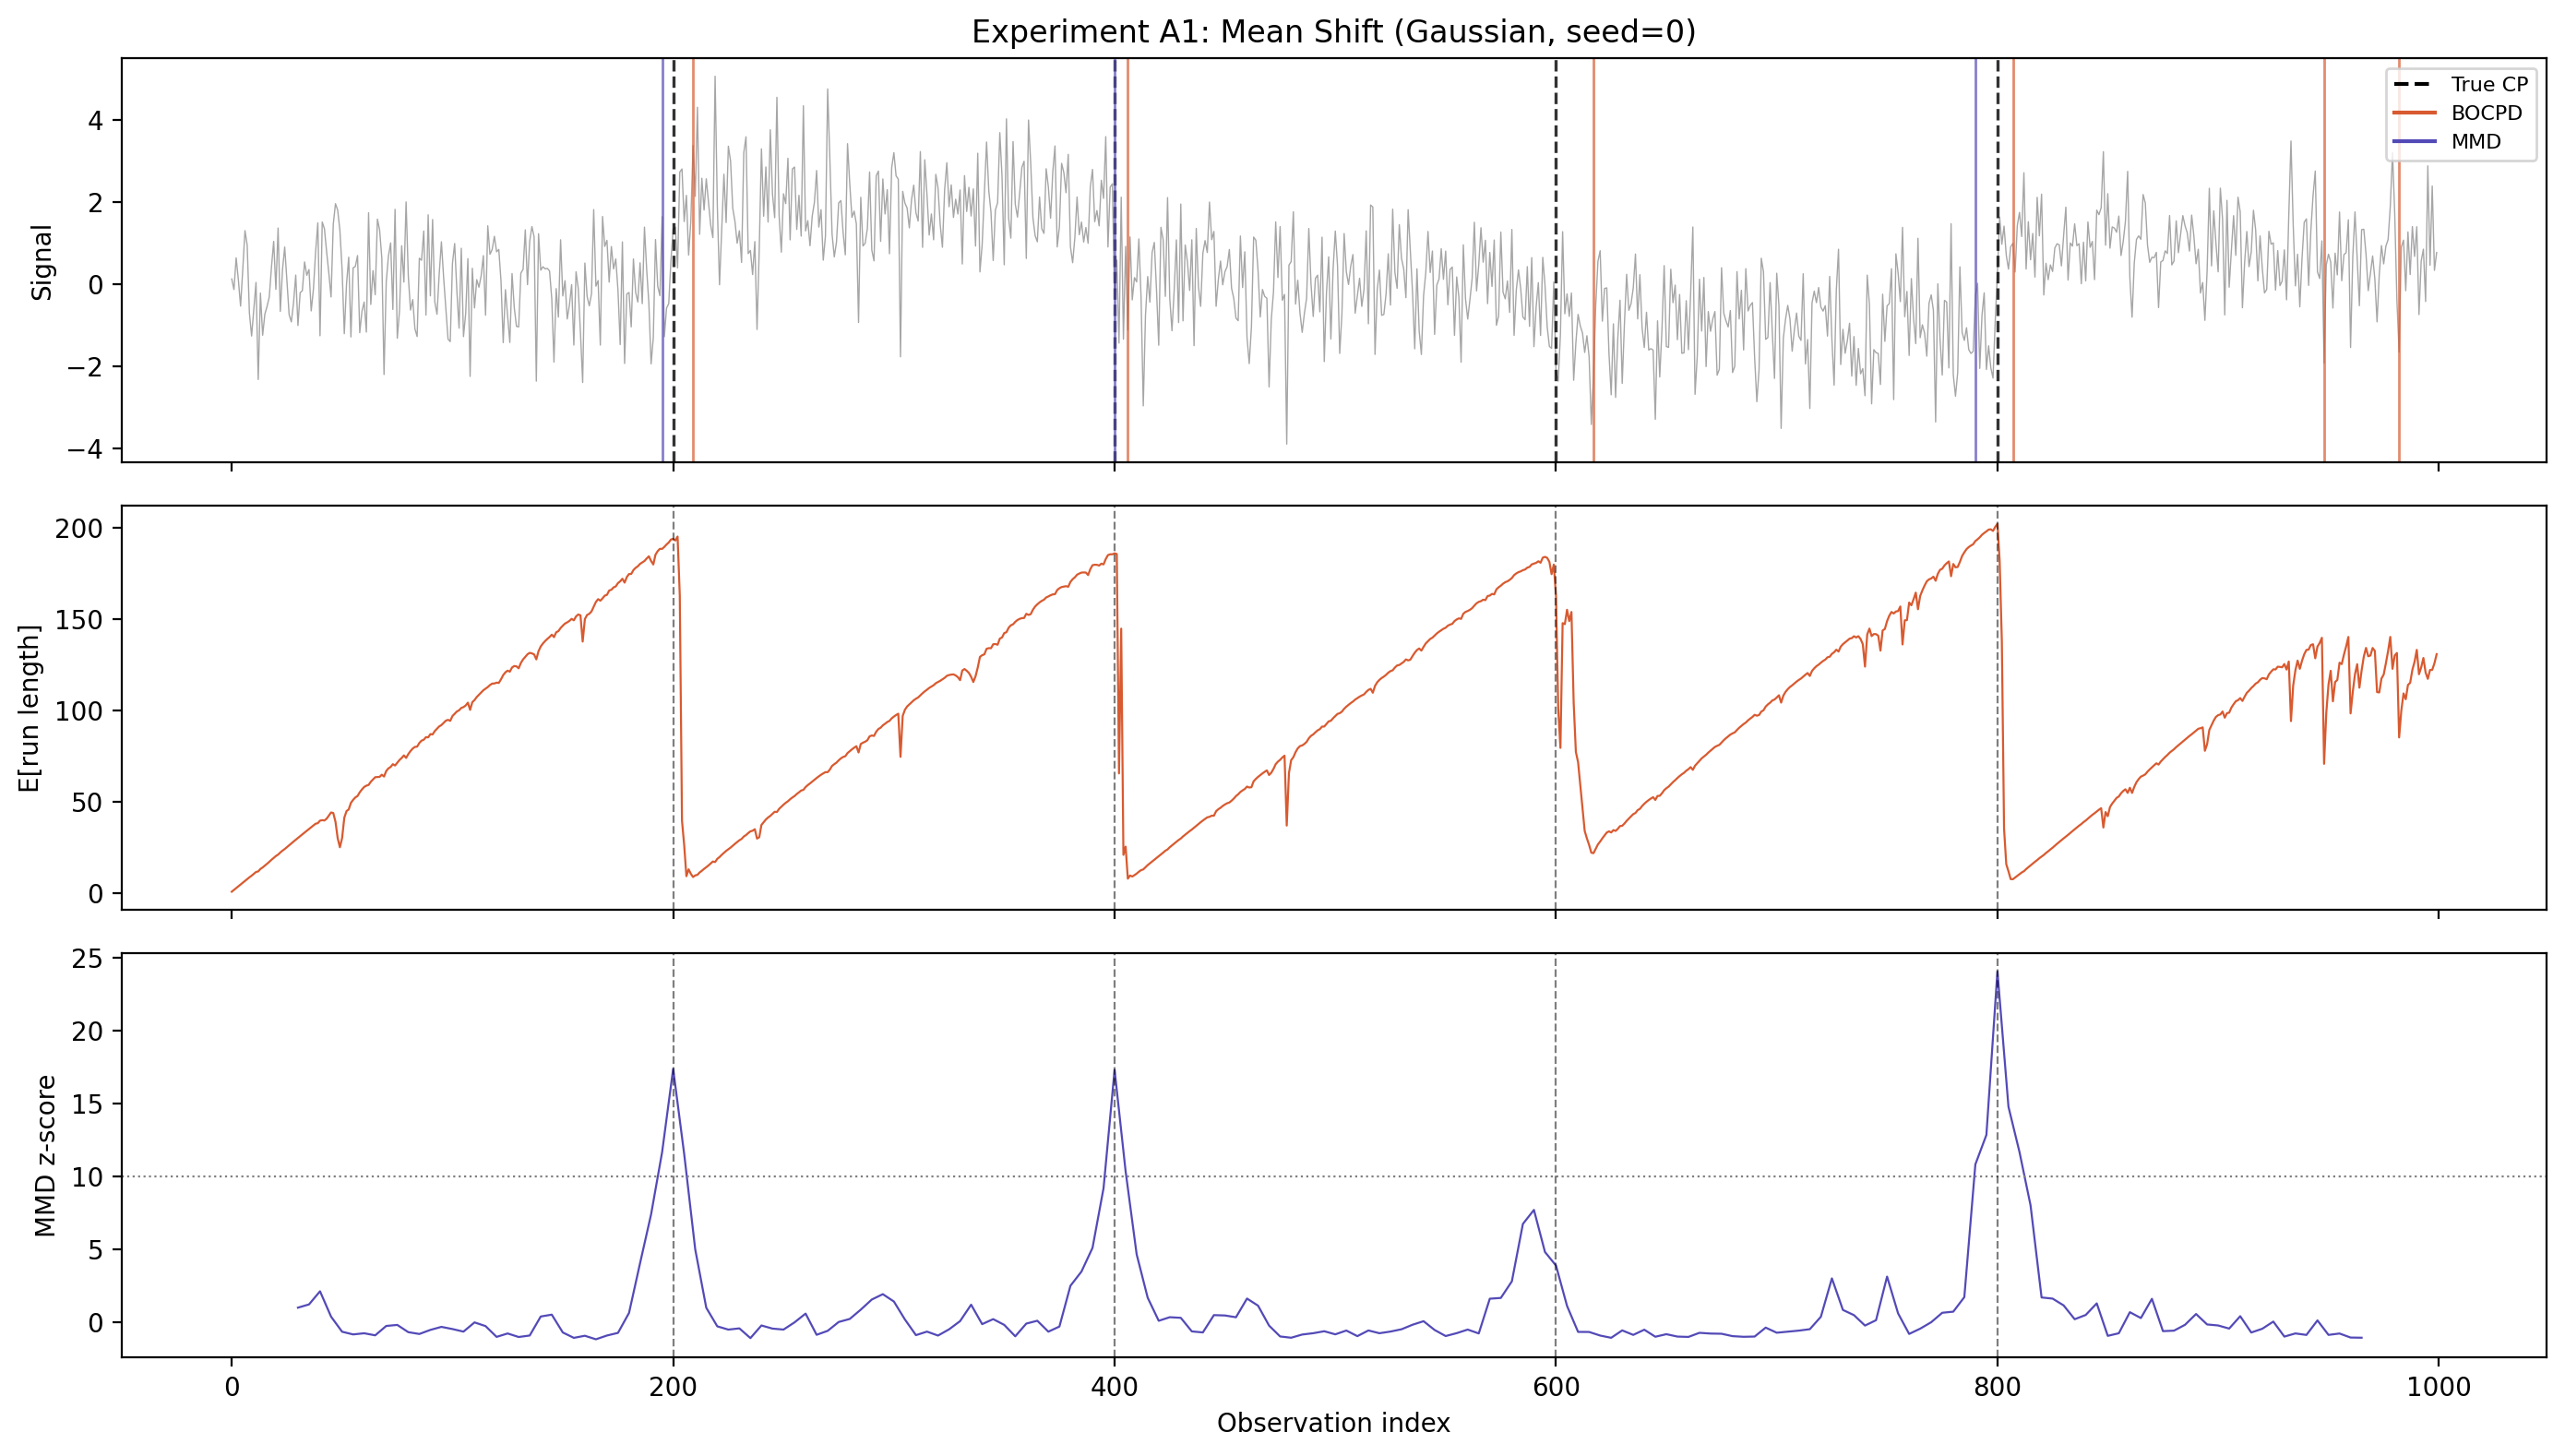
In this test, the data shifts between five segments with different means (the dashed vertical lines are the true change points). The top panel shows the raw data, the middle panel shows BOCPD's expected run length dropping sharply at each planted shift, and the bottom panel shows the MMD z-score for comparison. BOCPD catches all four change points with slight latency—it needs a few observations to become confident that the regime has changed, which is the expected behavior for an online method.
When Assumptions Break Down
BOCPD assumes data within each regime follows a bell curve (Gaussian distribution). This works well when it's true, but financial returns famously have fat tails—extreme days happen more often than a bell curve predicts. What happens when the data doesn't match the assumption?
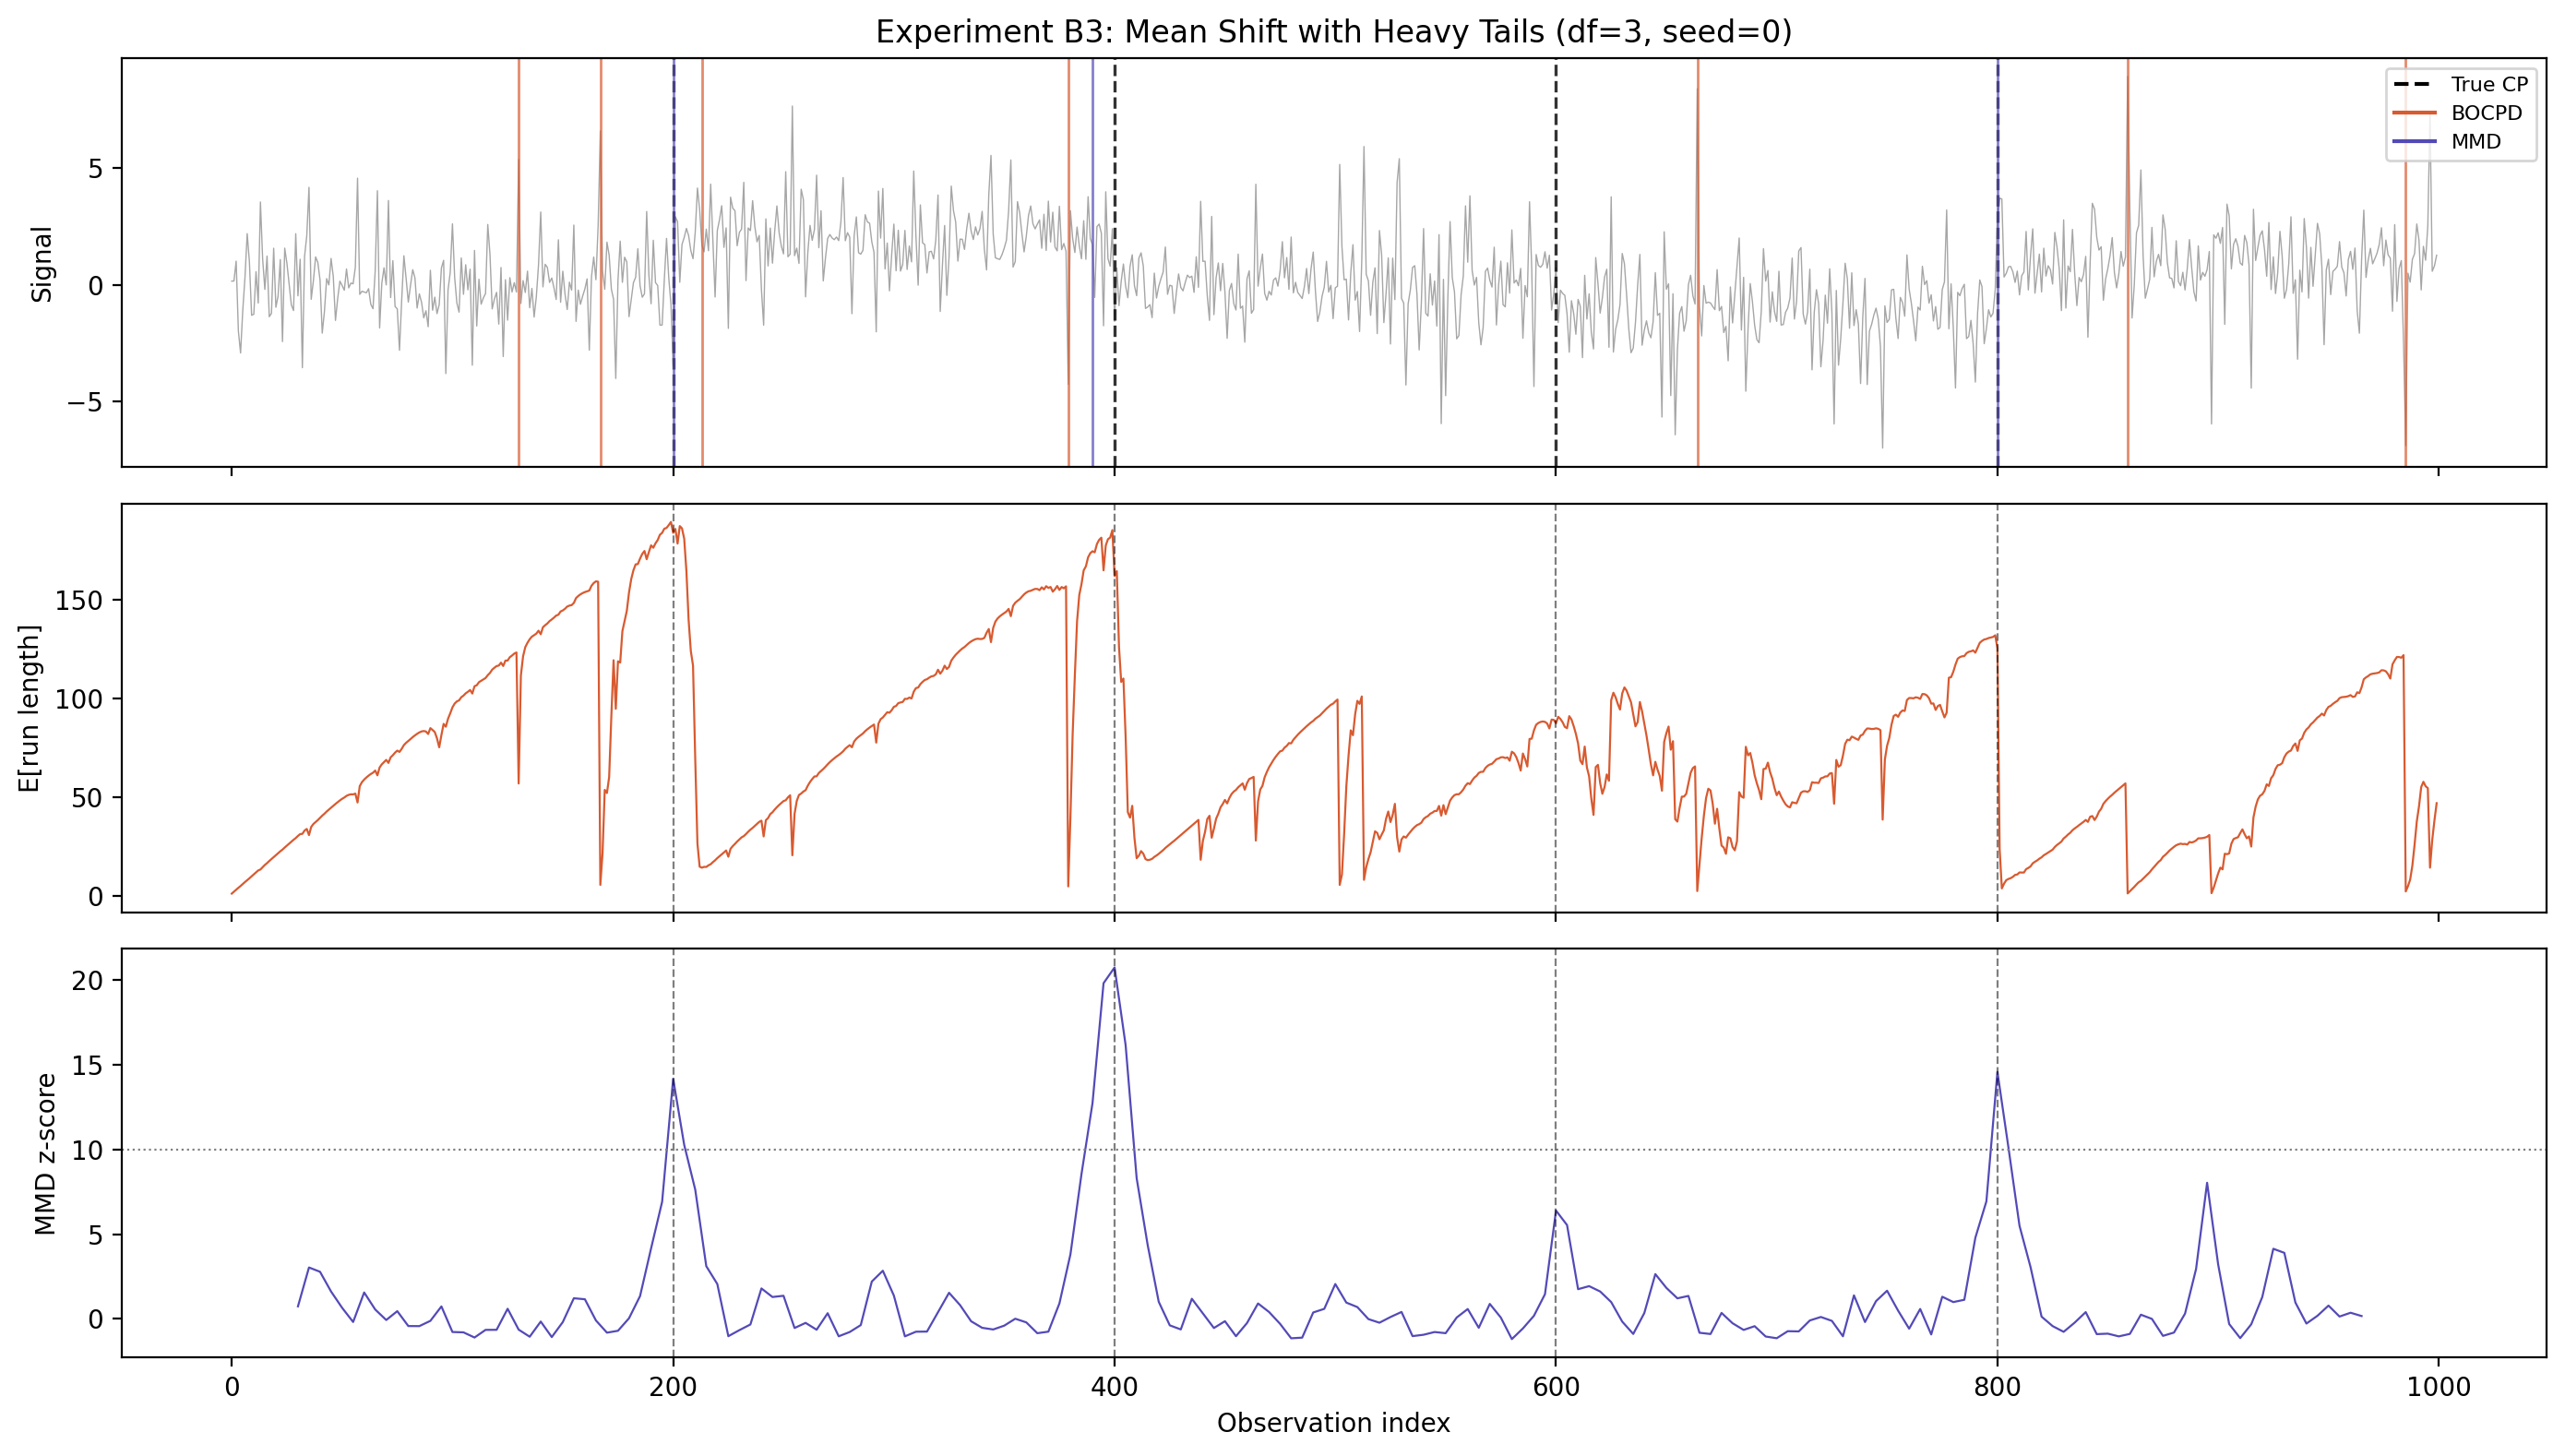
This test uses the same mean-shift setup, but with heavy-tailed data instead of Gaussian. BOCPD now fires 7 detections instead of 4—the extra ones are false positives caused by the model interpreting large but normal heavy-tailed observations as evidence of a new regime.
This matters because it tells us exactly where the method's weakness lies. We can quantify it by checking whether the credible intervals actually contain the true change points at the rate they claim:
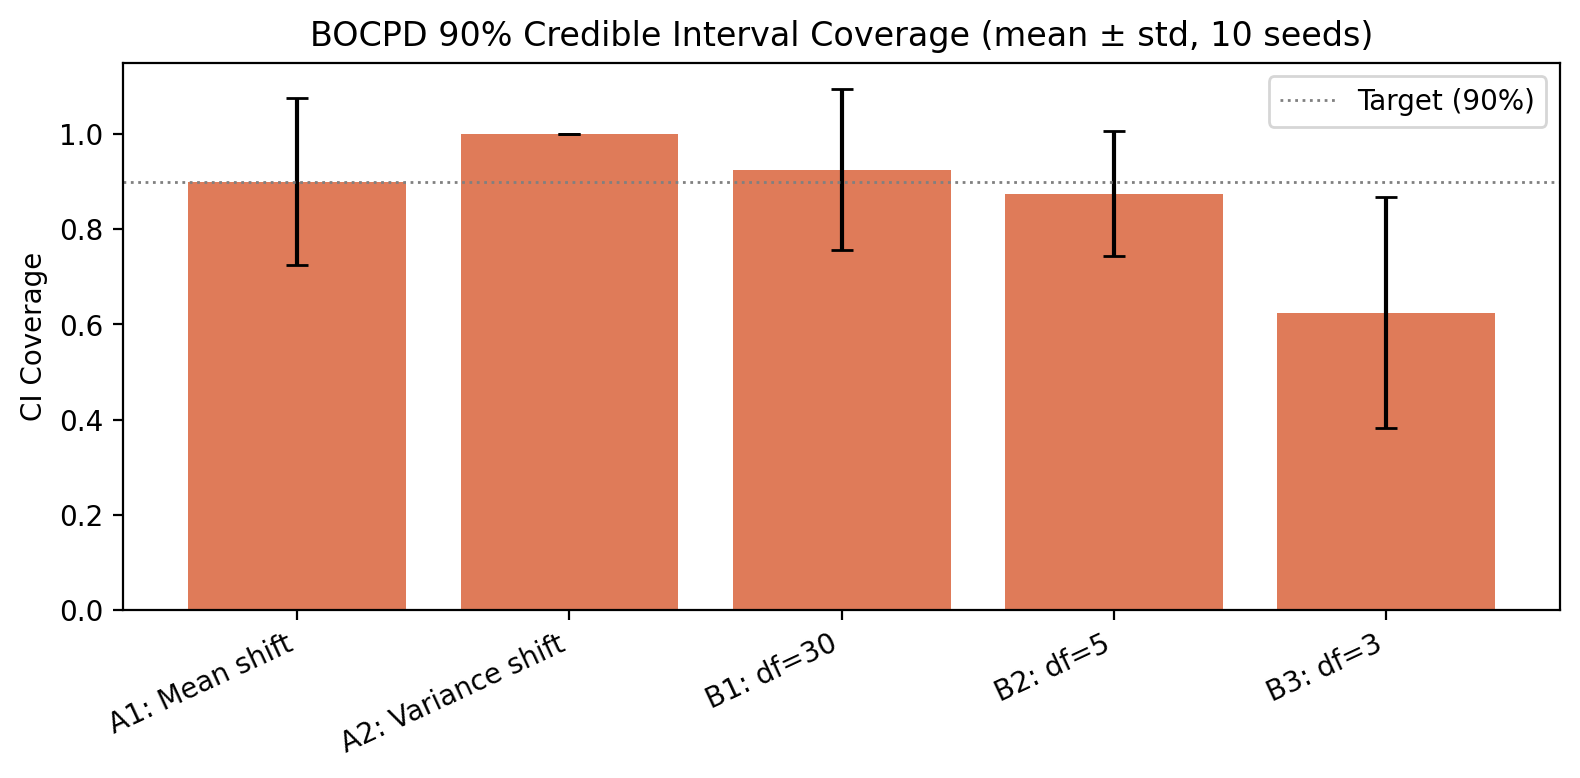
When the assumptions hold (mean shift, variance shift, mild tails), the 90% credible intervals actually contain the true change point about 90% of the time—the uncertainty estimates are well-calibrated. But under heavy tails (df=3), coverage drops to 62%. The model is still detecting real changes, but it's overconfident about exactly when they occurred.
What the Knobs Do
Hazard function shape is the most impactful choice. It encodes your belief about how regimes age. I tested three options:
- Constant (memoryless): a 10-day-old regime is as likely to end as a 300-day-old one
- Increasing (wear-out): older regimes are more fragile
- Decreasing (sticky): established regimes tend to persist
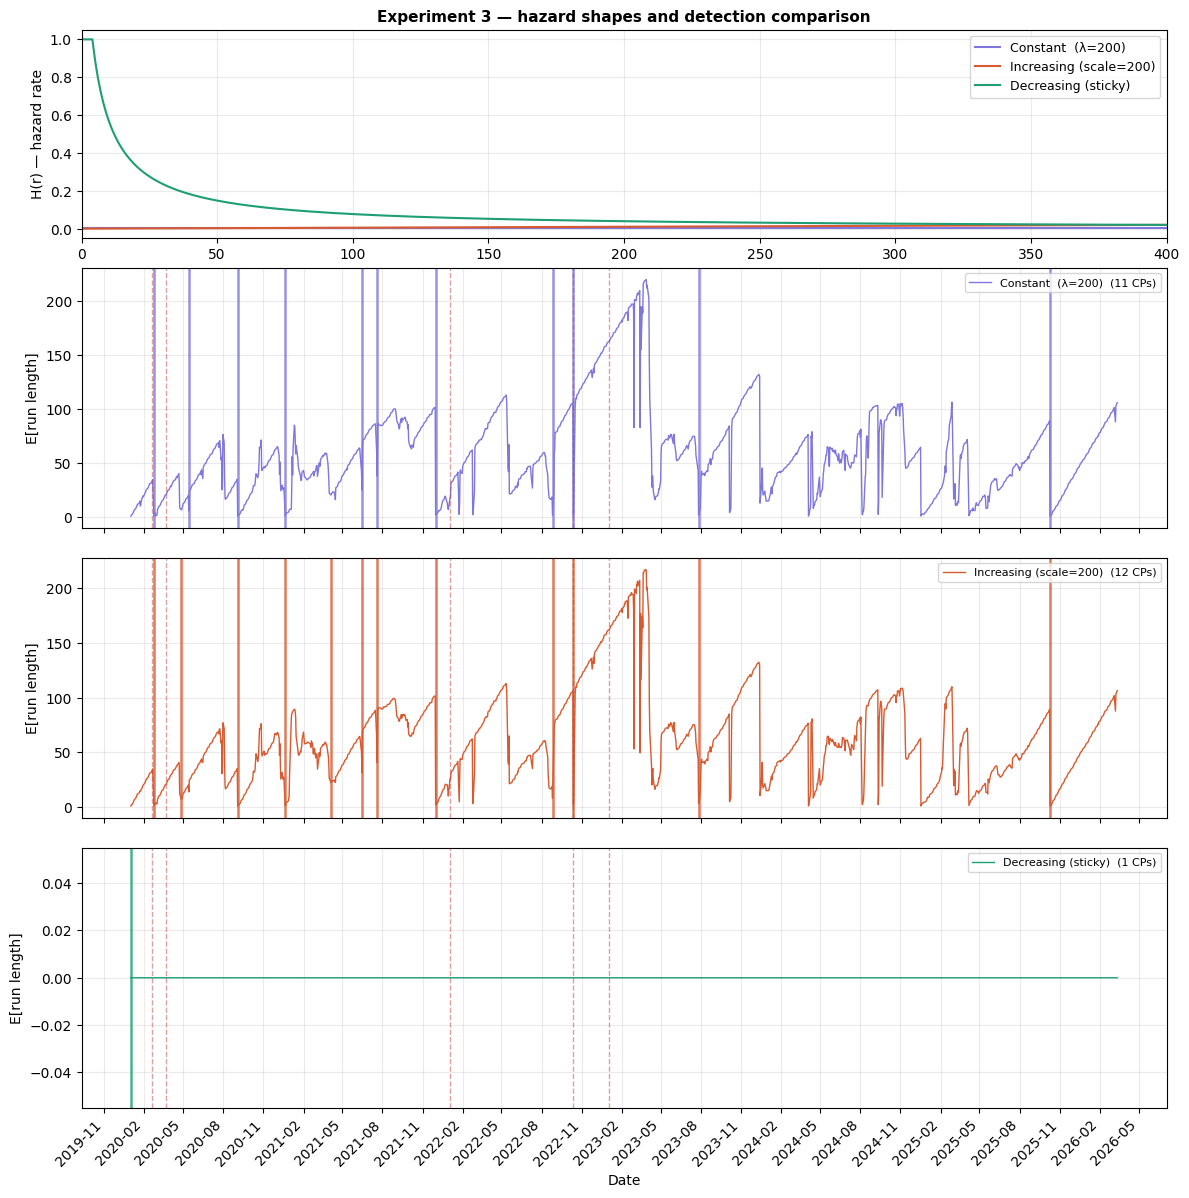
Constant and increasing hazard produce similar results (11 and 12 change points), while decreasing hazard detects only 1—the single strongest shift in the entire series. This isn't a gradual sensitivity; it's a near-binary switch. If you believe long-running regimes are hard to displace, the model will agree and barely flag anything. This is a genuine modeling decision, not just a dial to tune.
More broadly, this is where domain expertise plugs in. If you have a specific theory about how long regimes last in your system—whether that's financial markets, climate data, or sensor readings—you can encode it directly through the hazard function and prior. The algorithm is a framework that takes your assumptions and combines them with data, so the more informed those assumptions are, the better the output.
Prior strength controls how much evidence the model needs before it adapts. With weak priors, it's responsive and flags 11–13 boundaries. With strong priors, it's skeptical and requires larger shifts to trigger, finding only 6–7.
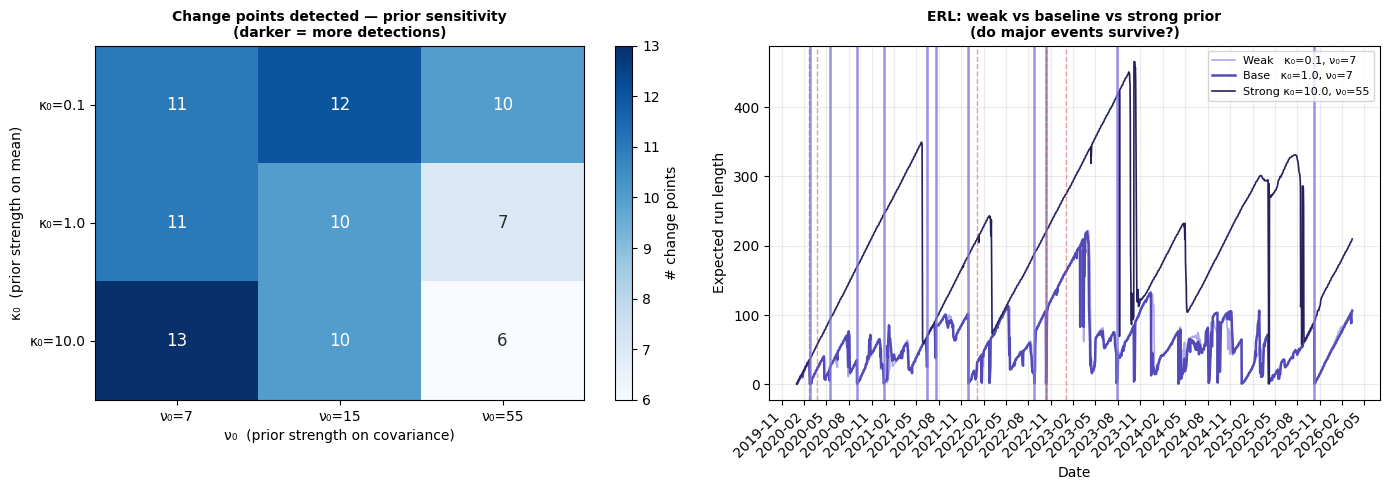
The reassuring finding: the timing of the strongest detections is stable regardless of prior strength. The major events like the COVID crash survive every configuration—what varies is whether the weaker, more ambiguous transitions get flagged.
Expected regime duration is surprisingly unimportant for this data. Across a 16x range (expecting regimes to last anywhere from 2.5 months to 3 years), the model finds 10–12 boundaries. The data speaks louder than this particular prior.
What BOCPD Gives You
BOCPD offers online detection (one observation at a time, no waiting), calibrated uncertainty (credible intervals on each change point), and a predictive envelope that adapts to the current regime in real time. The tradeoff is that you have to choose a model for what data looks like within each regime—when that assumption fits, the results are strong, and when it doesn't, you get false positives and overconfident intervals.
This is essentially the opposite tradeoff from MMD, a nonparametric method that makes no assumptions about the data but requires looking backward over windows rather than detecting in real time. One method is assumption-heavy but online; the other is assumption-free but retrospective. A follow-up post will put both approaches side by side on the same data to see where each one shines.
Future Work
The results in this post reflect the state of the project at the time of the course presentation. The underlying package continues to evolve and may no longer share all of the limitations discussed here.
For example, the heavy-tail problem shown above was an open limitation at the time. Since then, the package has been extended with Student-t observation models—both univariate and multivariate—that expect fat tails rather than being surprised by them. These use approximate methods rather than the mathematical shortcut that makes the Gaussian models fast, but they're available for anyone who needs robustness to outliers. Revisiting the experiments above with these models is a natural next step.
Beyond that, warm-up and state persistence would enable true online deployment—start the detector, let it learn, and keep it running without reprocessing history.
Code and Resources
The full implementation is available on GitHub: bocpd-regime-detection. The results in this post were produced with v0.1.0.
The repository includes detailed, rendered notebooks for those who want to dig deeper into any of the results discussed here:
For the full mathematical development of the algorithm, see the introductory slides. For experimental results including sensitivity analysis and synthetic validation, see the results slides. Both were presented as part of a Bayesian Statistics course at Portland State University.
References